If you don't monitor Postgres, you are not serious.
It's year 2026 and Postgres keeps the momentum. pgvector made it the default database for AI applications, and the warehouse giants paid up for Postgres vendors (Databricks bought Neon, Snowflake bought Crunchy Data). More Postgres in production means more Postgres to watch. This post reviews the tools and best practices for monitoring your Postgres database.
Open-source Tools
pg_stat_statements
The first thing is to enable the pg_stat_statements extension.
CREATE EXTENSION pg_stat_statements;pg_stat_statements tracks planning and execution statistics of all SQL statements executed by a server. It's also a prerequisite for other more advanced monitoring solutions.
psql=# SELECT query, calls, total_exec_time, rows, 100.0 * shared_blks_hit /
nullif(shared_blks_hit + shared_blks_read, 0) AS hit_percent
FROM pg_stat_statements ORDER BY total_exec_time DESC LIMIT 5;
-[ RECORD 1 ]---+--------------------------------------------------------------------
query | UPDATE pgbench_tellers SET tbalance = tbalance + $1 WHERE tid = $2
calls | 3000
total_exec_time | 20756.669379
rows | 3000
hit_percent | 100.0000000000000000Prometheus Postgres Exporter
Prometheus Postgres Exporter extract Postgres database metrics and store them in Prometheus. From there, you can use Prometheus Alertmanager to configure alerting rules and use Grafana to create dashboards.
Proprietary Solutions
pganalyze
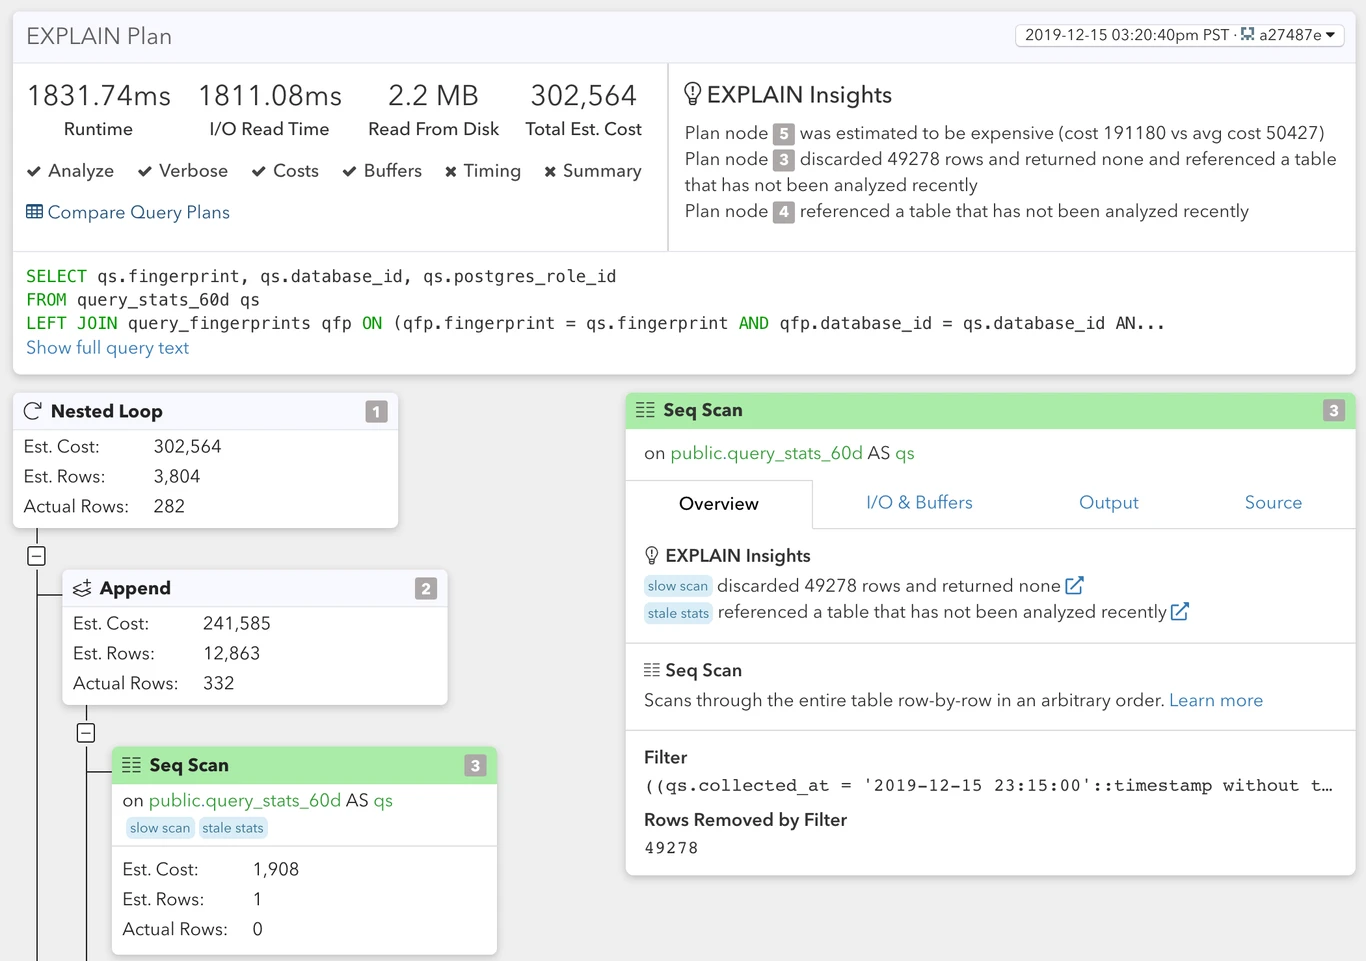
pganalyze is a Postgres specific observability service. It provides in-depth SQL tuning and performance monitoring. Pricing is per database server, with plans starting at $149 per month.
DataDog
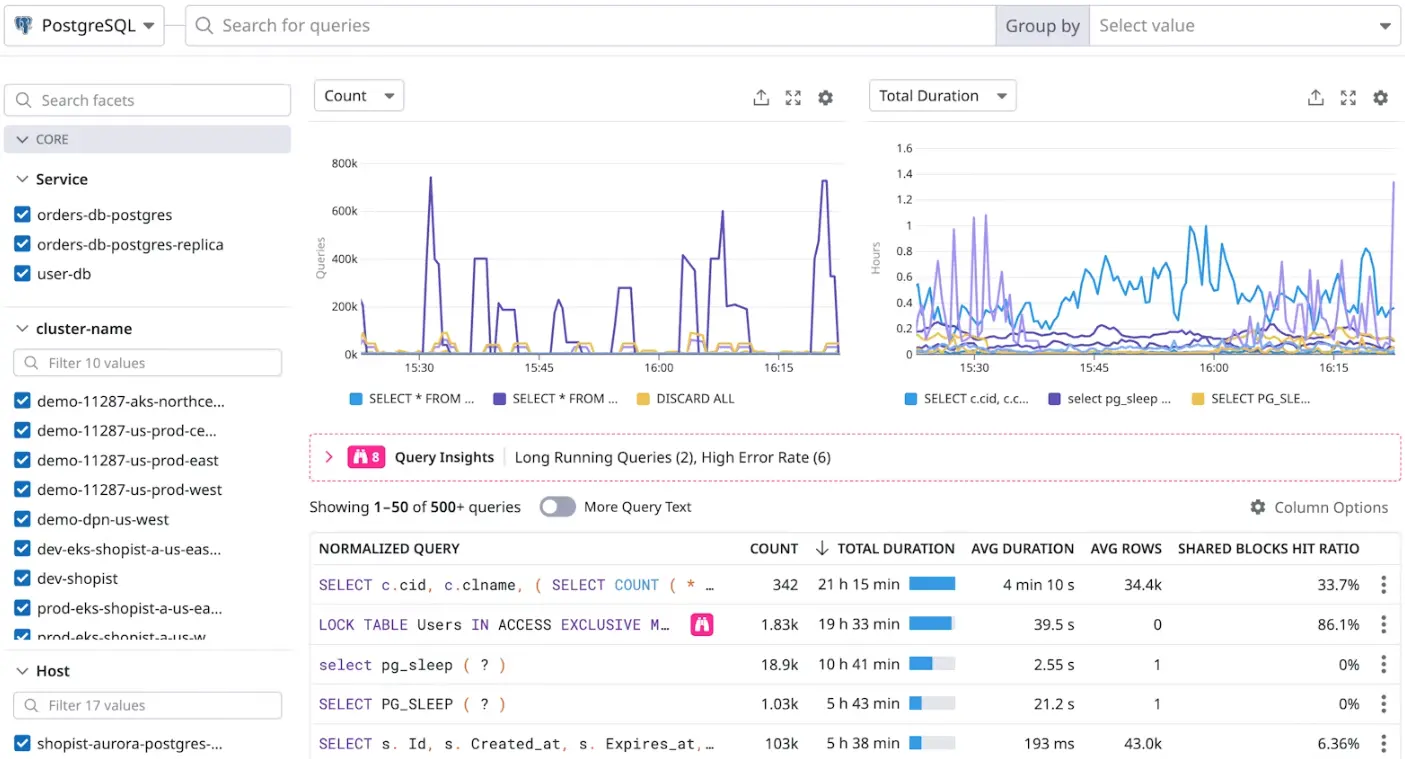
DataDog provides Postgres Database Monitoring. Its Postgres monitoring is not as extensive as pganalyze. DataDog's advantage is its integration with the entire application stack and the CI/CD pipeline. The price starts at $70 per database server per month.
Other Options
-
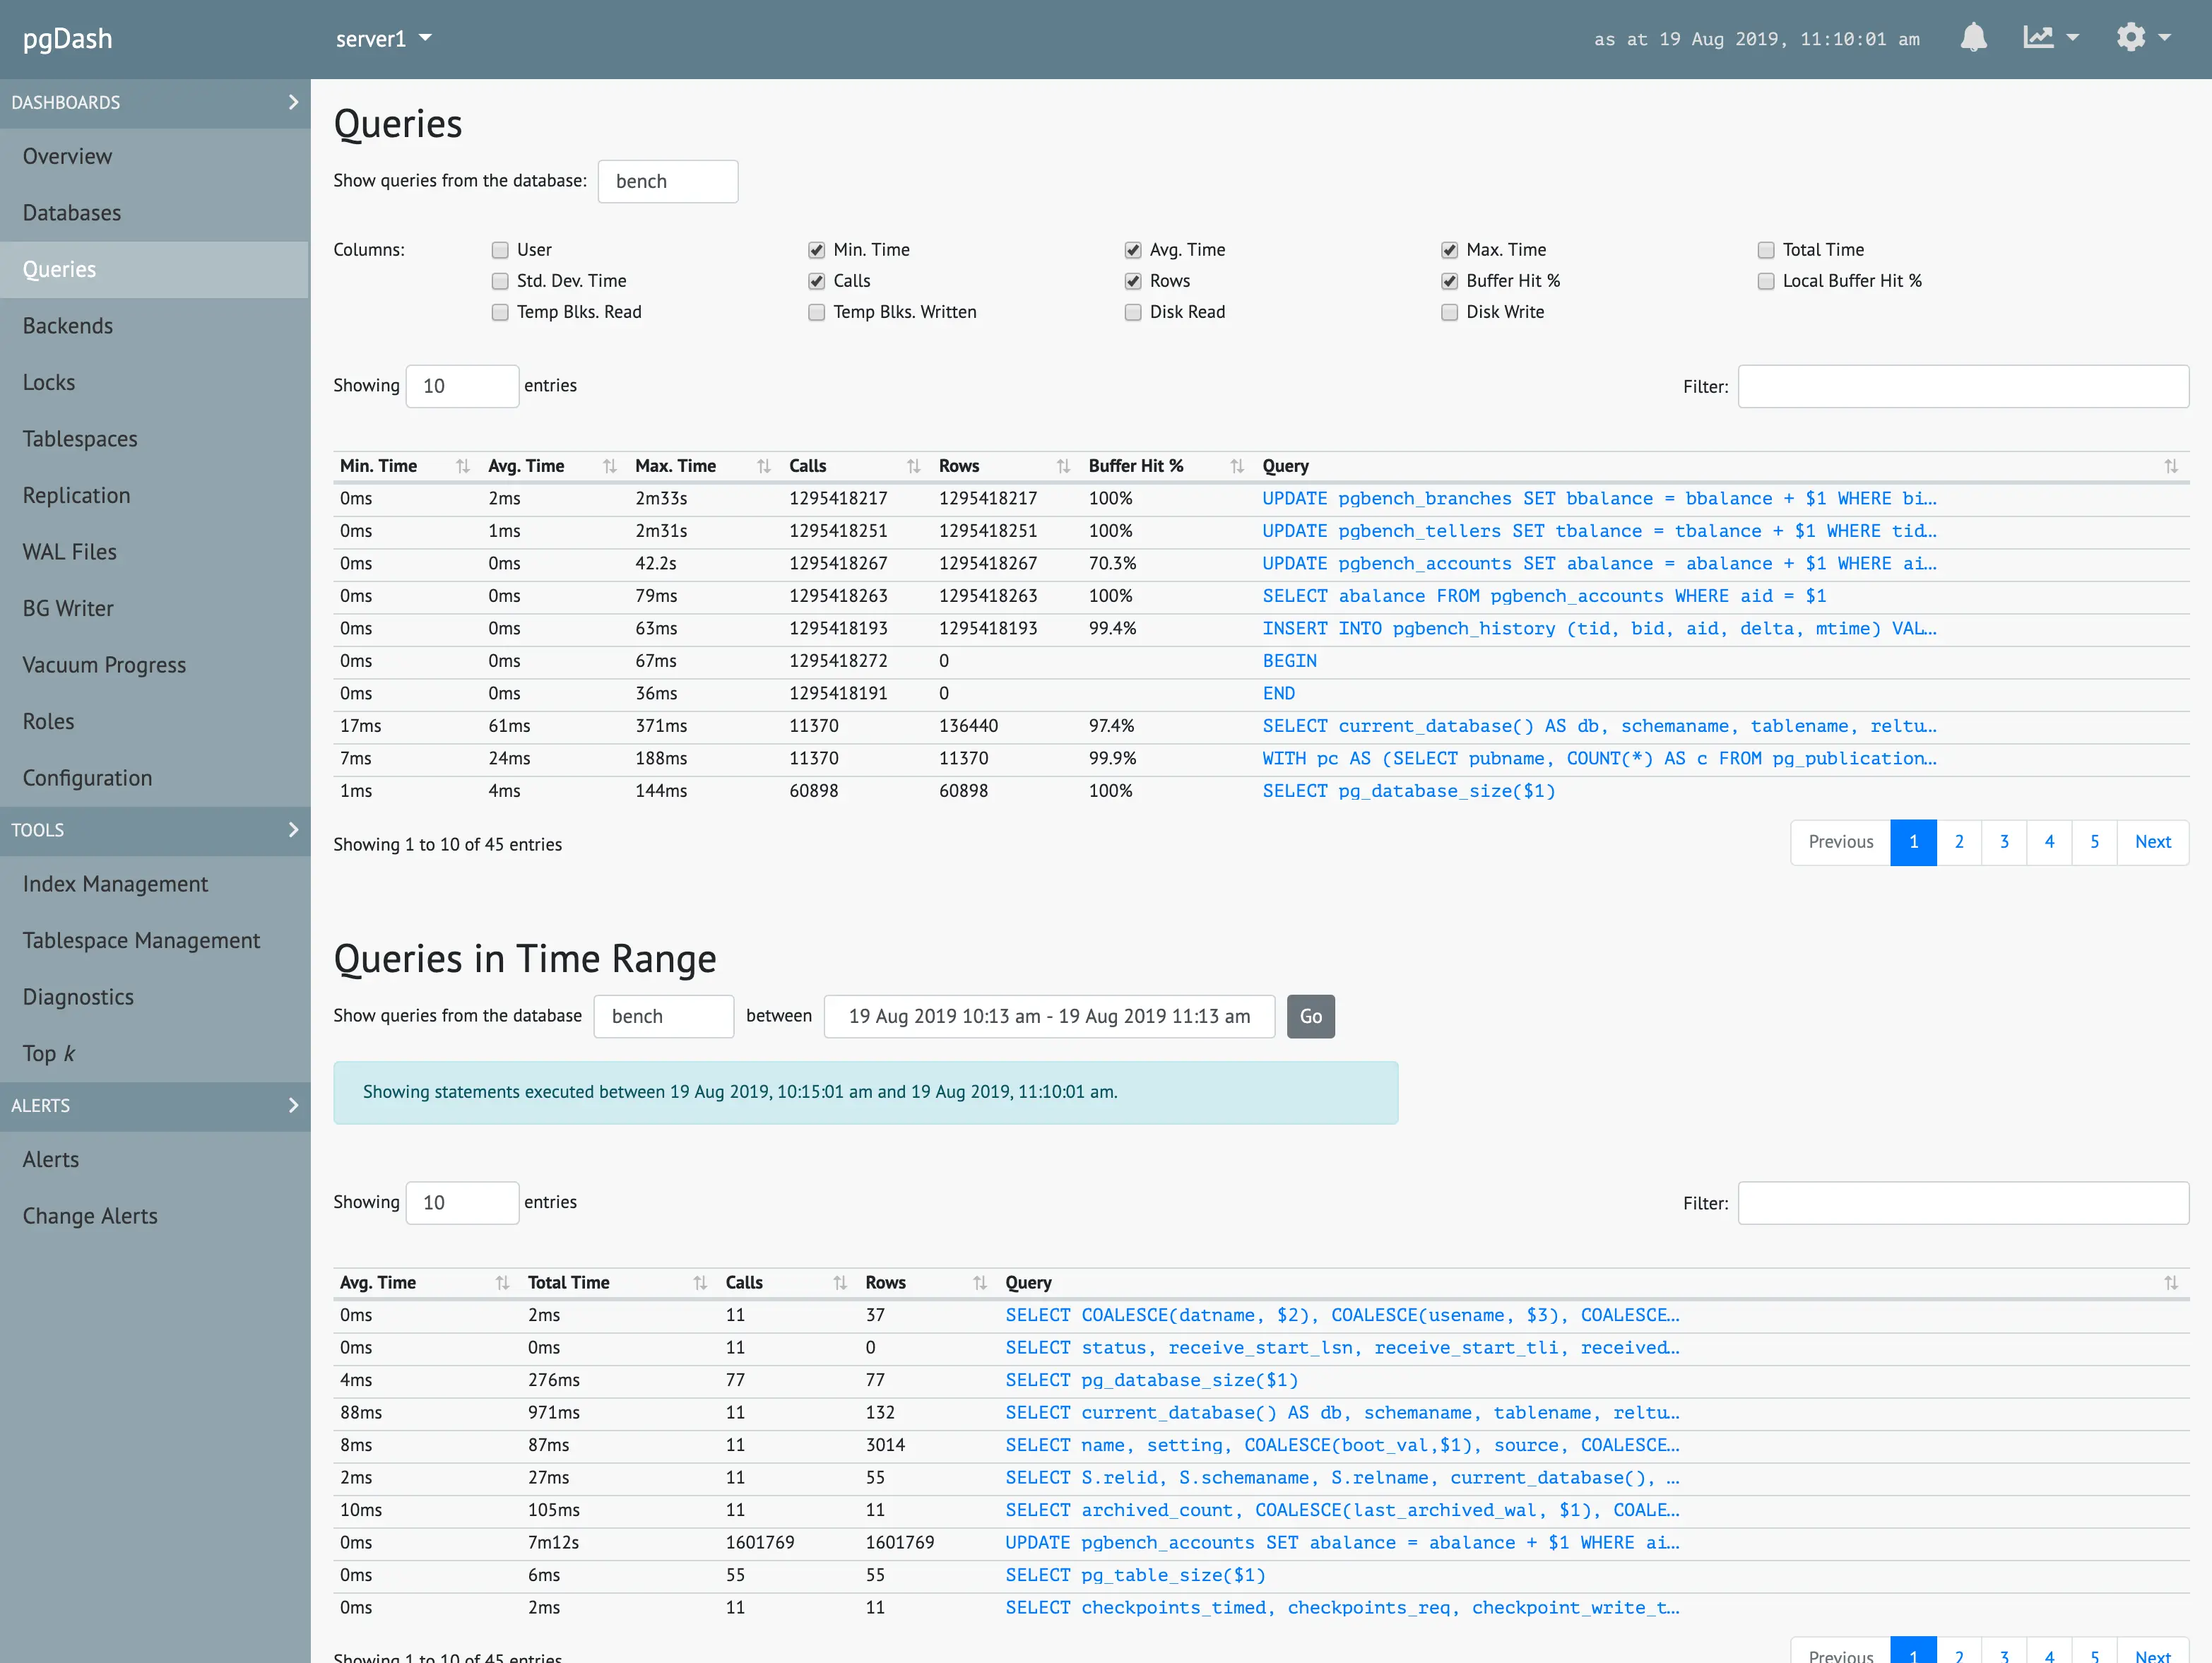
pgDash has a similar feature set and pricing point to pganalyze. pgDash looks less polished. On the other hand, pgDash offers self-hosted option for all plans, whereas pganalyze only offers self-hosted option for the Enterprise plan.
-
SolarWinds Database Performance Monitor (DPM) also provides Postgres database performance solution. Its technology comes from the VividCortex acquisition. It's cloud-only with a steep, enterprise-oriented price.
Best Practices
Monitor Transaction ID Wraparound
Due to PostgreSQL's MVCC implementation, it has an infamous transaction ID wraparound risk. When this happens, it will render the entire database unavailable, see some past incidents (Sentry, Mailchimp, Figma). Every capable Postgres monitoring service and database service provider can check this risk:
- pganalyze checks every 30 minutes
- Implement an Early Warning System for Transaction ID Wraparound in Amazon RDS for PostgreSQL
- GCP Cloud SQL high-transaction-ID-utilization recommender
Monitoring Locks
Use pg_locks view to find any lock problems. You can find connections that have held locks for a long time as well as connections that have waited too long to acquire the lock.
You should also consider enabling log_lock_waits.
Avoid Blocking Operations
It's always a good practice to set lock_timeout on the user.
When making DDL changes, try to use non-blocking statements. e.g. add index with CONCURRENTLY, add constraint with NOT VALID.
You can configure SQL Review in Bytebase and detect such anti-patterns.
Use a Cloud Postgres Service Provider
Every managed Postgres provider ships basic monitoring out of the box, and to be honest, for most teams that alone justifies not self-hosting. There are more options at more price points than ever; we keep a running comparison of the Postgres hosting providers and their pricing.
If you must self-host for budget or compliance reasons, start with Prometheus + Grafana, and upgrade to pganalyze or Datadog once the business can pay for it. Buy the monitoring before you need it. The wraparound incident does not wait for your procurement cycle.
A comprehensive monitoring solution can be intimidating. We try to provide actionable suggestions to companies from different stages. Please let us know if you have other monitoring tools and best practices worth sharing to herd the elephant.